This was actually one of the very first projects that I did for exploring Machine Learning in Python. My primary goal was to get a basic understanding about how Machine Learning works, all the way from basic data exploration, how to select reasonable variables, encoding categorial variables such as sex, all the way up to clustering passengers in different age categories to enhance the learning process.
All the data was taken from Titanic: Machine Learning from Disaster (Kaggle Competition)
Step 1 Importing Libraries as well as train and test set
import numpy as np
import pandas as pd
from sklearn.linear_model import LogisticRegression
from matplotlib import pyplot as plt
from sklearn.model_selection import train_test_split
from sklearn.metrics import accuracy_score
from sklearn.model_selection import cross_val_score
import seaborn as sns

test = pd.read_csv("/Users/niklaskuehn/Desktop/Python and Machine Learning/kaggle Datasets/titanic/test.csv")
train = pd.read_csv("/Users/niklaskuehn/Desktop/Python and Machine Learning/kaggle Datasets/titanic/train.csv")
Step 2 Some basic Data Exploration
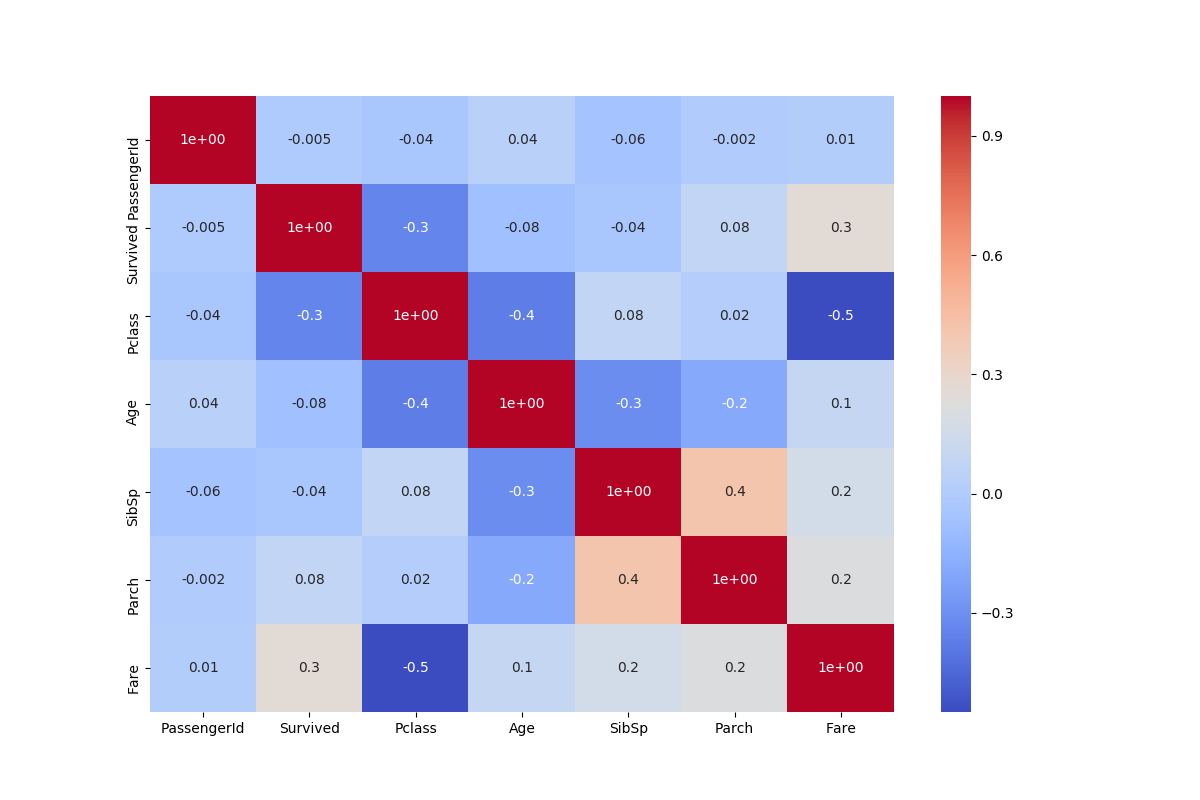
correl = train.corr()

### Create a Seaborn Heatmap that visualizes the correlation of the different variables in the dataset
plt.figure(figsize=(12,8))
sns.heatmap(correl,annot=True, cmap='coolwarm',fmt=".1")
plt.show()

### Show the distribution of Age and Passenger Class
Class1 = train[ train["Pclass"] == 1]
Class2 = train[ train["Pclass"] == 2]
Class3 = train[ train["Pclass"] == 3]

Class1["Age"].plot.hist(alpha=0.5, color="red", bins=50)
Class2["Age"].plot.hist(alpha=0.5, color="blue", bins=50)
Class3["Age"].plot.hist(alpha=0.5, color="green", bins=50)
plt.show()

### Show the distribution of Age and Survived
Survived1 = train[train["Survived"] == 1]
Survived0 = train[train["Survived"] == 0]

Survived1["Age"].plot.hist(alpha=0.5, color="blue", bins=50)
Survived0["Age"].plot.hist(alpha=0.5, color="red", bins=50)
plt.show()

Step 3 Prepare the data for Machine Learning, in this case LogisticRegression
def age_categories(df, cut_points, label_names): ### Function that returns a new column for every label, depending on the cut points
    df["Age"] = df["Age"].fillna(-0.5)
    df["Age_categories"] = pd.cut(df["Age"],cut_points,labels=label_names)
    return df

cut_points = [-1,0,5,10,20,30,50,100] ### Clustering the Age into different categories, so it is easier for the model to train
label_names = ["Missing", "Child", "Youth", "Teenager", "Young Adult", "Adult", "Old"]

train = age_categories(train,cut_points,label_names)


def create_dummies(df, column_name): ### Function that creates new columns with either 0 or 1
    dummies = pd.get_dummies(df[column_name],prefix=column_name)
    df = pd.concat([df,dummies], axis=1)
    return df

train = create_dummies(train, "Age_categories")
train = create_dummies(train, "Sex")
train = create_dummies(train, "Pclass")
Step 4 Logistic Regression and Evaluation
lr = LogisticRegression(solver="lbfgs")

### Define columns on which the model should be trained:
columns = ['Pclass_1', 'Pclass_2', 'Pclass_3', 'Sex_female', 'Sex_male',
       'Age_categories_Missing','Age_categories_Child',
       'Age_categories_Youth', 'Age_categories_Teenager',
       'Age_categories_Young Adult', 'Age_categories_Adult',
       'Age_categories_Old']

### Preparing the data to split them into a training and into a test
### set while using the sklearn.model_selection train_test_split function
X = train.drop(["Survived", "Name", "Sex", "Ticket","Age_categories"], axis=1)
y = train["Survived"]

all_X = train[columns]
all_y = train["Survived"]

train_X, test_X, train_y, test_y = train_test_split(all_X, all_y, test_size=0.2, random_state=0)

### Fit the Logistic Regression to the target we wish to predict
lr.fit(train_X, train_y)

### Store the predicitons made on the test_X dataset into a new variable so we can check the accurracy using
### sklear_metrics accuracy_score
predictions = lr.predict(test_X)

### Finding out the accuracy score
accuracy = accuracy_score(test_y, predictions)
print(accuracy)

scores = cross_val_score(lr, all_X, all_y, cv=10)
print(np.mean(scores))
Using the above metrics, I was able to get an accuracy score of about 0.796. Or in other words, given a specific age, sex and passenger class, I was able to predict whether a passenger was able to survive the titanic disaster or not with an accuracy of about 80 percent.
