My goal with this mini-project was, to get a very basic idea about how K-Means Clustering works.
Here are the different steps that I performed:
Step 1 Importing relevant Libraries and defining a Cluster of Size 1.000
import numpy as np
import pandas as pd
import matplotlib.pyplot as plt
from sklearn.cluster import KMeans

SIZE = 1000
DIVISOR = 10
NUMBER_OF_CLUSTERS = 10

Cluster = {"X": np.random.randint(0, 50, size=SIZE)/DIVISOR,
           "Y": np.random.randint(100, 150, size=SIZE)/DIVISOR}
Step 2 Transform Cluster to Dataframe
df = pd.DataFrame(Cluster, columns=["X", "Y"])
df = df.sample(frac=1)
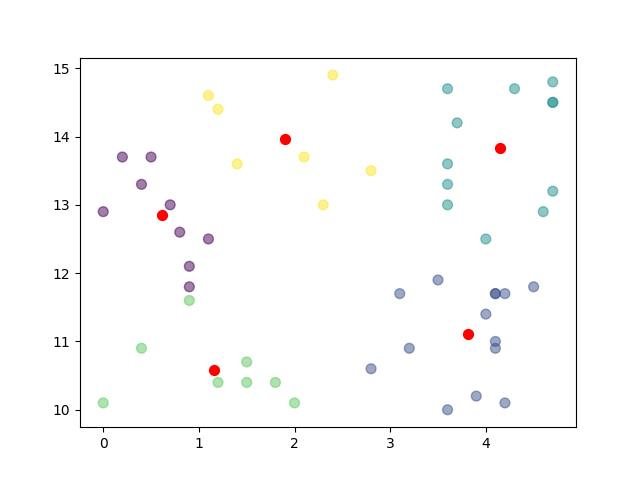
Step 3 Apply K-Means Algorithm and plot the Results using Matplotlib
kmeans = KMeans(n_clusters=NUMBER_OF_CLUSTERS).fit(df)
centroids = kmeans.cluster_centers_

plt.scatter(df["X"], df["Y"], c= kmeans.labels_.astype(float),s=50, alpha=0.5) ### Plotting the different Clusters with different colours
plt.scatter(centroids[:, 0], centroids[:, 1], c="red", s=50) ### Plotting the centroids
plt.show()

There you have it, a very simple implementation of K-Means Clustering.